Why consumer theory assumes local nonsatiation.
Saturday, November 21, 2015

Wednesday, November 20, 2013
Friday, October 11, 2013


Grad school, illustrated
Tongue-in-cheek first lesson in econometrics (plus addendum):
http://www.uibk.ac.at/econometrics/lit/siegfried_jpe_70.pdf
http://www.latrobe.edu.au/__data/assets/pdf_file/0004/251869/2013.02.pdf
http://www.uibk.ac.at/econometrics/lit/siegfried_jpe_70.pdf
http://www.latrobe.edu.au/__data/assets/pdf_file/0004/251869/2013.02.pdf
Variance, illustrated
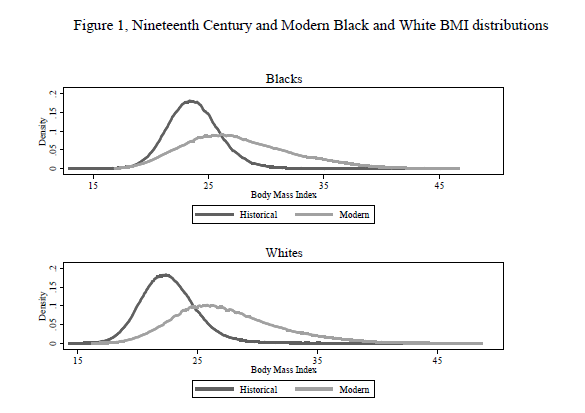
Source: "There has been an increase in the mean body-mass index since the 19th century but even more strikingly there has been an increase in the variance, what we might call an increase in weight inequality."
Negative externalities, illustrated
Earth orbit debris: an economic model
Space debris, an externality generated by expended launch vehicles and damaged satellites, reduces the expected value of space activities by increasing the probability of damaging existing satellites or other space vehicles. Unlike terrestrial pollution, debris created in the production process interacts with firms' final products, and is, moreover, self-propagating. Collisions between debris or extant satellites creates additional debris. We construct an economic model to explore private incentives to launch satellites and to mitigate space debris. The model predicts that, relative to the social optimum, firms launch too many satellites and under-invest in debris mitigation technologies. We discuss remediation strategies and policies, and calculate a socially optimal Pigovian tax.

Tuesday, August 27, 2013
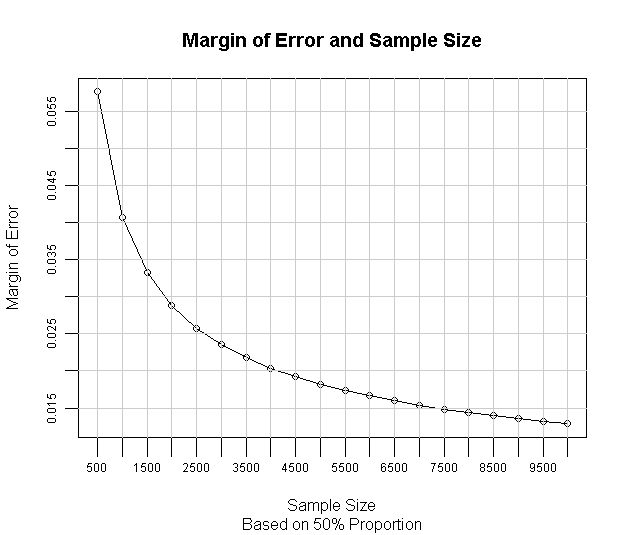
Confidence intervals, illustrated

If you resample very many times, and compute confidence intervals for each sample, then a 95% CI means that 95% of those intervals will capture the true pop. value of the random variable.
Also, the larger your sample, the lower your margin of error:
Monday, August 26, 2013
Monday, August 12, 2013

Wednesday, July 24, 2013
Spurious regression, illustrated
Source:

There is a quadratic relationship between the percentage of males in a country who smoke and per capita health care spending. The relationship is statistically significant, as is shown in the table on the right.
The moral of the story? Don't conclude anything from regressions on country-level data.

The problem with analyses like this one is shown in the picture below. There is a very strong positive relationship between a country's income and the amount of money that is spent on health care: as income increases, health care spending increases. There is also a relationship - though a more complex one - between income and smoking. The poorest of the poor cannot afford cigarettes. As income increases, smoking rates increase. But in the most affluent countries, rates of smoking are lower again.
There is a quadratic relationship between the percentage of males in a country who smoke and per capita health care spending. The relationship is statistically significant, as is shown in the table on the right.
The moral of the story? Don't conclude anything from regressions on country-level data.
The problem with analyses like this one is shown in the picture below. There is a very strong positive relationship between a country's income and the amount of money that is spent on health care: as income increases, health care spending increases. There is also a relationship - though a more complex one - between income and smoking. The poorest of the poor cannot afford cigarettes. As income increases, smoking rates increase. But in the most affluent countries, rates of smoking are lower again.
Wednesday, June 12, 2013

Saturday, May 11, 2013
Substitution effect, illustrated
Sin tax dampens San Miguel liquor sales
MANILA, Philippines – Ginebra San Miguel Inc, the beverage arm of diversified conglomerate San Miguel Corp, experienced a 30% drop in volume sales after the government implemented a higher excise tax on alcohol products.
MANILA, Philippines – Ginebra San Miguel Inc, the beverage arm of diversified conglomerate San Miguel Corp, experienced a 30% drop in volume sales after the government implemented a higher excise tax on alcohol products.
Sunday, April 14, 2013

Sunday, March 31, 2013
Some housekeeping
Henceforth I'm changing the blog's name from "Self-Illustrated Econ Nerd" to "Economics, illustrated". I figured the blog might better serve its purpose by simply curating excellent examples of economics in action through articles, graphics, and videos.
An old archive of my Economics, Illustrated blogs can be found at http://opinionator2010.blogspot.com.
Ciao!
An old archive of my Economics, Illustrated blogs can be found at http://opinionator2010.blogspot.com.
Ciao!
Subscribe to:
Posts (Atom)